Options Statistics Panel
The panel provides you a quick summary of options statistics based on the current underlying symbol.
Layout
Click the Options Statistics tab on the right side of the OptionStation Pro window to open the Options Statistics panel.
 Implied Volatility Gauge
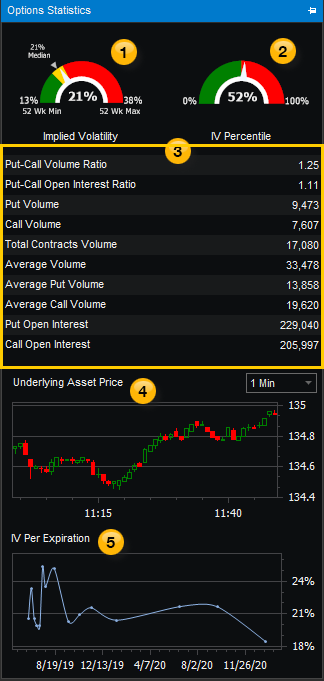
Displays the range of implied volatility (IV) for the underlying asset over the last 52 weeks. The green band represents the lowest IV range, the yellow band is the median IV range, and the red band is the highest IV. The center of the gauge shows the IV for the day relative to the last 52 weeks.
 IV Percentile Gauge
Shows the current IV percentile relative to the year displayed within the gauge.
 Key Options Metrics
Displays a list of key options metrics for the underlying asset.
 Underlying Asset Price
Shows the trend of the underlying asset price on a bar chart using the specified interval (1 min, 5 min, or 30 min).
 IV Per Expiration
Displays a graph of the implied volatility (IV) average at each expiration date.